What is Year-Over-Year [YOY] – Definition
Year-over-year growth or, “YOY” for short, is a common financial comparison metric used by analysts to measure the financial performance of a company on an annual basis. It helps them get a better understanding of a company’s financial growth and changes over the past year. It’s also a very quick and convenient way to compare a company’s growth over time.
Summary
- Year-over-year (YOY) growth is a common metric used to gauge changes in financial and economic performance
- It allows investors and businesses to quickly compare growth changes
- There are other alternatives used to gauge financial and economic growth like YTD, MTD, Quarterly growth
What is Year-Over-Year [YOY] Used For?
Year-over-year growth is traditionally used to look at important economic data such as :
- Inflation
- Unemployment
- GDP growth
- Interest rates
These are just a few of the many economic metrics that YOY growth is used to track and make sense of economic changes. In addition to this, year-over-year is used to analyze changes in financial performance for companies for metrics such as:
- Total revenue
- Cost of revenue
- Gross profit
- Operating expenses
- Operating Income
These are just a few of the many different financial performance figures for which YOY growth can be used to assess changes. Comparing how some of these financial metrics change over a given year can provide valuable insight for investors. An added benefit to using year-over-year is that it removes month-to-month performance fluctuations which may distort the longer-term performance of a company.
For example, some companies may have the majority of their sales in a specific quarter. Looking at financial performance on a longer (YOY) time frame removes month-to-month fluctuations and illustrates a more balanced performance.
YOY Growth Formula – How to Calculate YOY Growth
Year-over-year is a straightforward calculation expressed in percentage terms.
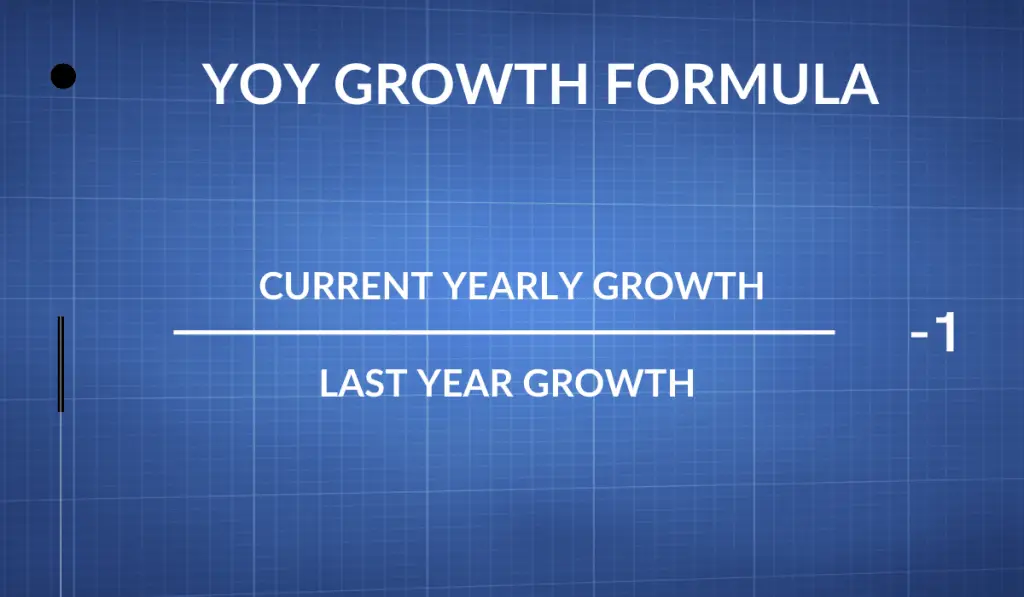
Calculating the YOY involves taking the current year’s growth value, dividing it by last year’s growth, and subtracting one: (current year) ÷ (previous year) -1. The YOY growth percentage can be positive and negative because growth can decrease.
Year-Over-Year Example (Inflation)
In 2022, the U.S. Bureau of Labor Statistics reported the inflation rate hit 8.3%. This is the highest rate of inflation the United States has experienced in the past 20 years. In 2021, the U.S. Labor Bureau reported the inflation rate at 7%.
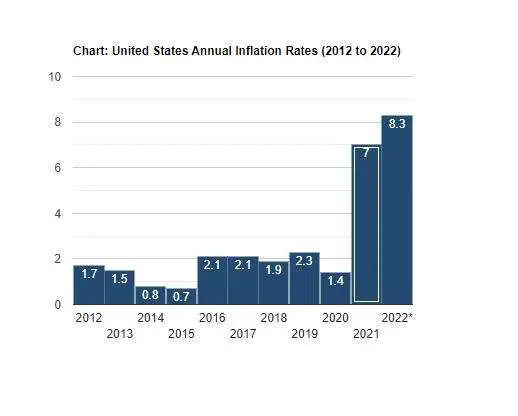
This represents an inflation increase of 1.3% from 2021. It represents an 18.57% YOY growth in the inflation rate.
Inflation Rate 2022 = 8.3%
Inflation Rate 2021 = 7%
YOY Growth = (8.3)/(7.3) -1 = 18%
It’s important to be aware of the difference between increase and growth. It’s an important distinction to make when measuring these metrics, especially in financial and economic scenarios. An inflation increase of 1.3% may not seem that significant. However, when you look at the actual YOY growth of inflation in percentage terms, it paints a different picture. An 18% YOY growth in the inflation rate is a significant economic increase.
Year-Over-Year Growth Alternatives
If you want to see how financial or economic performance fluctuates inside a given year there are some alternatives. They include YTD, MTD, and quarterly growth. They can provide us with a shorter-term growth comparison.
YTD – Year-To-Date
- Year-To-Date uses the period of time starting from the first day of the current calendar year up to the current date. It’s a useful financial metric to help analyze performance as data unfolds throughout the year. Analysts use it as a method of comparing current financial and economic data to historical year-to-date data. It gives insight into whether or not a company is on track for growth for the year or trailing behind the previous year.
MTD – Month-to-Date
- Month-to-Date uses the period of time between the 1st day of the current month and the last business day before the current date. If you want to look at financial and economic performance on a short-term basis, MTD is the metric to use. Providing MTD data, as well as MTD data from previous months, allows analysts, managers, and investors the opportunity to compare growth performance in past periods
Quarterly Growth
- There are 4 financial quarters in a standard financial year. The majority of publicly traded companies release their earnings every 3 months. They are commonly denoted as Q1, Q2, Q3, and Q4. It refers to growth in the company’s financials from one quarter to the next. YOY growth is derived when the numbers in Q4 are released. Quarterly growth splits the full year into 4 equal parts and can give us insight into seasonal growth, trends, along with dependencies on supply and demand.
Conclusion
Year-over-year is an important financial metric that can help us understand the growth of a company as well as an economy on an annual basis. If you’re an investor it’s important to understand how it’s measured the impact it has on your investments and the overall economy.